Running and debugging
Searching stored data
Every run keeps what it held of each object, and a shared struct keeps its records. The Data and Records pages show them as tables you search with a faceted query: type one, or tick values in the Filters panel, and the server searches every stored row, not only the ones on the page.
What the tables hold
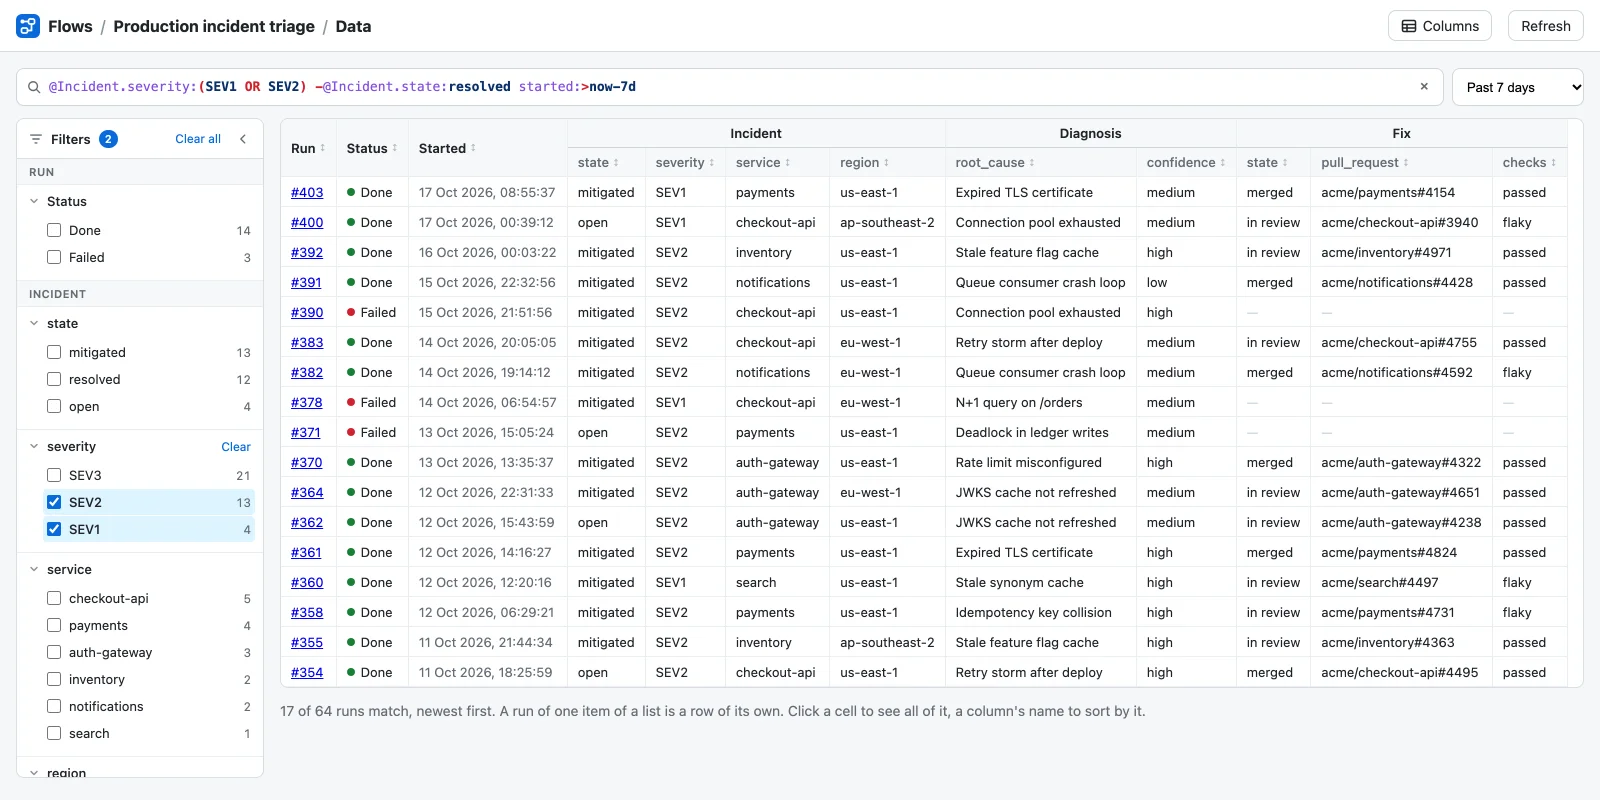
A flow's Data page, opened with Data in the board's toolbar, has a row for each run, the newest first. A run of one item of a list is a row of its own. Its columns are the run, its status and when it started, then a group per object: the object's state and each of its fields, with the latest value the run's steps gave it. A revision after a review replaces the first draft, and a person's decision sets the state.
A shared struct's Records page, opened with Records on the struct's board, has a row for each record, the latest written first: its number, its state, a column per field, when it was last updated, and the run that wrote it. See Shared records.
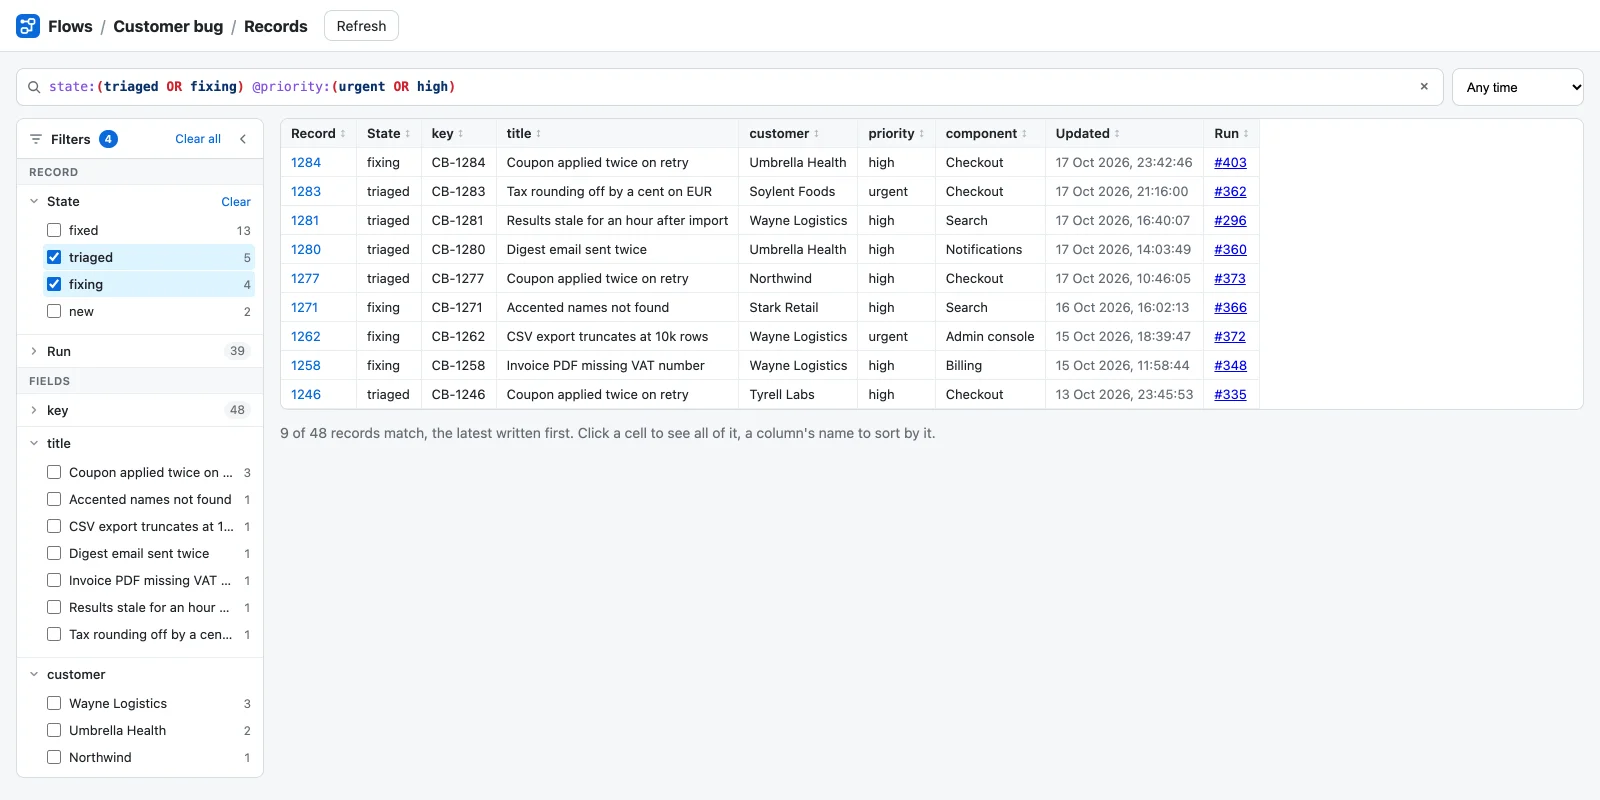
Both pages search the same way. The search looks through the latest 20 000 runs or records, and the table shows the first 200 runs, or 1000 records, that match. The footer says how many match, such as 17 of 64 runs match, and says when there were more than 20 000 to search.
The query bar
A query is terms, and a row has to match all of them. Matching ignores case. As you type, the bar colours the query and underlines a key that doesn't exist. It suggests keys, then a key's values with how many rows have each; pick one with Tab or ↓. The × clears it.
| Query | Finds the rows |
|---|---|
timeout, "in sync" | With any value holding the word, or the phrase |
status:failed | Whose value for the key is that |
-status:done, NOT status:done | That don't match |
status:(failed OR interrupted), a OR b | That match either; brackets group terms |
title:*crash* | Matching a wildcard: * stands for any text |
@Invoice.amount:>100, :<=5, :[10 TO 20] | With a number above, at most, or between two, both included |
started:>now-1d, started:2026-10-16 | From a time: now less 15m, 4h, 1d or 2w, or a date |
@Bug.owner:*, [email protected]:* | With any value for the key, or with none |
Typing never fails: what doesn't read as a query is searched as text, and a key with nothing after its colon yet doesn't narrow anything. A key that doesn't exist matches no row.
Keys
Every column is a key. The table's own columns are keys as they are; what objects hold takes an @.
| Page | The table's own | What objects hold |
|---|---|---|
| Data | run, status, started, started_by, item, parent | @Incident.severity for a field, @Incident.state for the state, and @Notes for an object without fields, such as a list or text |
| Records | id, state, updated, run | @priority for a field |
The @ can be left out, and on the Data page so can the object, where no other key has the name: severity:SEV1 finds @Incident.severity. Spaces in names become underscores, as in @Exception_Details.subject.
The Filters panel
Left of the table, the Filters panel has a facet for each column, grouped by object on the Data page, listing its values and how many rows have each. Ticking values writes them into the query, and unticking takes them out: ticking SEV1 and SEV2 under severity writes @Incident.severity:(SEV1 OR SEV2).
- Tick a value to add it to those shown; click its name to show only it, and again to show all. Tick no value for rows without one.
- A facet's counts are of the rows the rest of the query leaves, leaving out what is ticked in that facet itself. With SEV1 and SEV2 ticked, SEV3 still says how many SEV3 runs there would be.
- A facet lists its 50 most common values; one you've ticked stays listed. One with many values has a Filter values box and Show all N. Values over 200 characters, such as an agent's long write-up, aren't listed, but searching for their text finds them.
- A facet whose values are mostly each a row's own, such as a key or a run, starts folded, with how many values it has. Click its name to open it.
- Each facet has its own Clear. In the panel's header, a badge says how many values are ticked, and Clear all unticks every one, leaving the text you typed and the time range.
- ‹ folds the panel into a narrow Filters rail beside the table, which keeps the badge; click it to open the panel again. On a narrow screen it folds into a bar above the table. The panel stays open or folded on your next visit, on every table page.
Time range
The menu beside the query bar, from Any time through Past 15 minutes, Past hour, Past 4 hours, Past day and Past 7 days to Past 30 days, writes the range into the query: started:>now-7d on the Data page, updated:>now-7d on the Records page. Edit it there for any other range.
Sorting
Click a column's name to sort by it, again for the other way, and a third time to go back to the table's own order. Times sort newest first on the first click. Rows with no value for the column come last either way. Hiding a column with Columns leaves it in the search and the sort.
From a cell
Click a cell to see all of its value. On the Data page, a short value also has Show only these and Leave these out, which add it to the query, or its opposite.
Links and memory
The query and the sort are kept in the page's address, as ?q=…&sort=…, with a - before a key sorted the other way, such as sort=-started. A link opens the same view for whoever follows it. Without one, each page opens with the search you last left it with, in this browser.